The analytics service is optional. You can disable it by setting
OPS_ANALYTICS_ENABLED variable to false in your .env file if you don’t need analytics functionality.Analytics admin portal
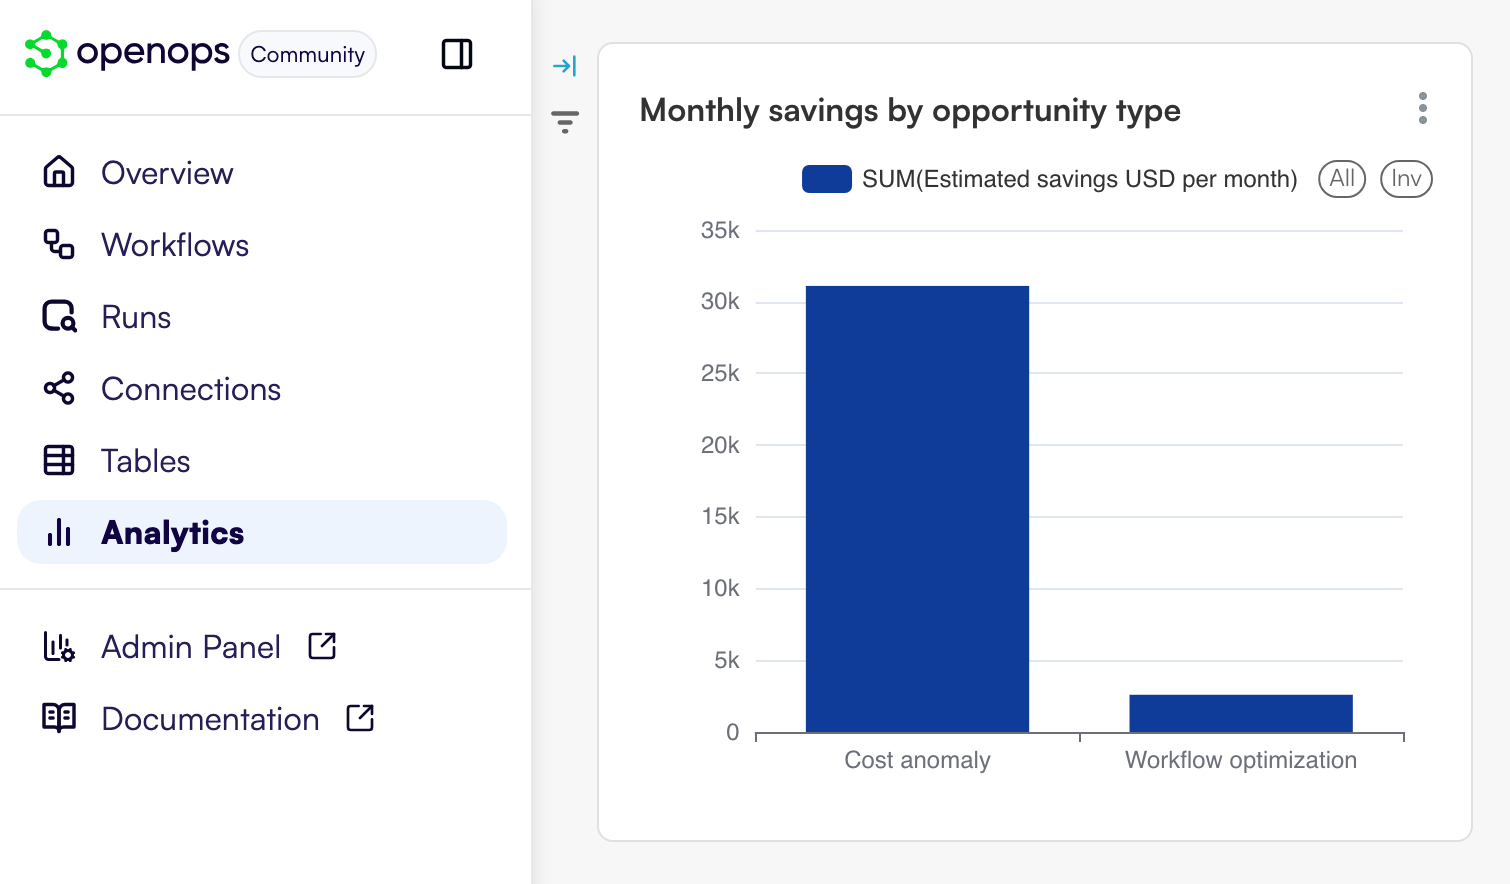
To configure data visualizations, click Analytics on the main navigation bar in OpenOps. When the Analytics view opens, click Admin Panel to proceed to the Analytics admin portal that is separate from the main OpenOps application. To sign in to the Analytics portal, useadmin as the username and the password defined with the OPS_ANALYTICS_ADMIN_PASSWORD variable in the .env file in your OpenOps installation folder. (If you haven’t changed the password, the default is please-change-this-password-1.)
If you don’t have access to the OpenOps installation folder:
- Contact your OpenOps instance administrator if you’re using a self-managed OpenOps instance.
- Contact OpenOps support if you’re using an OpenOps-hosted instance.
Building new charts
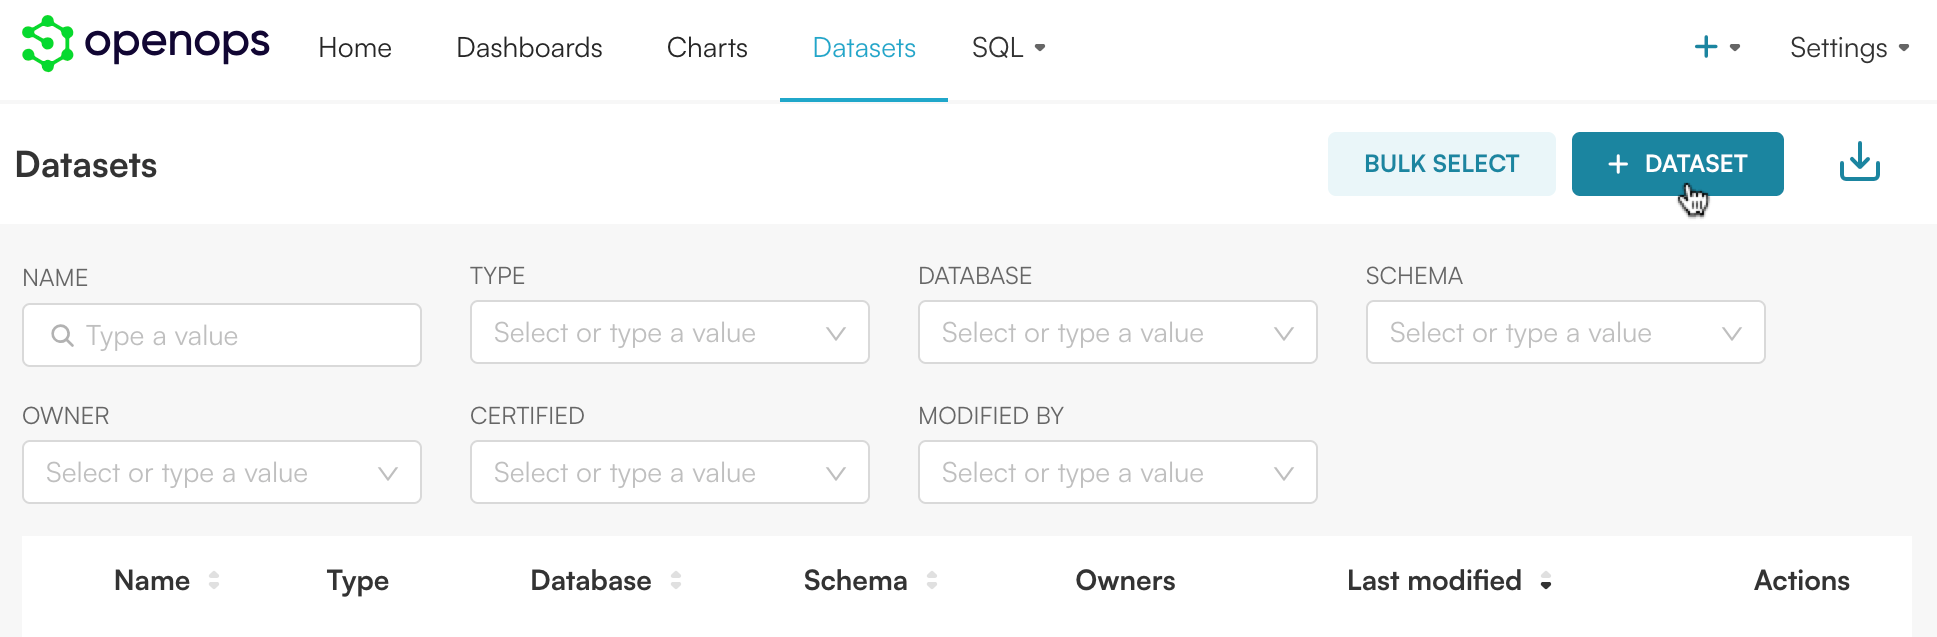
To configure a new chart based on an OpenOps table to display in the Analytics view in OpenOps, do the following:- Navigate to Datasets and click + Dataset:
- Select
openops_tables_connectionfor Database andpublicfor Schema. In the Table dropdown, select a Postgres DB view corresponding to the OpenOps table you want to source data from. For example, here is what a view may be named for the Opportunities table: - Click Create dataset and create chart.
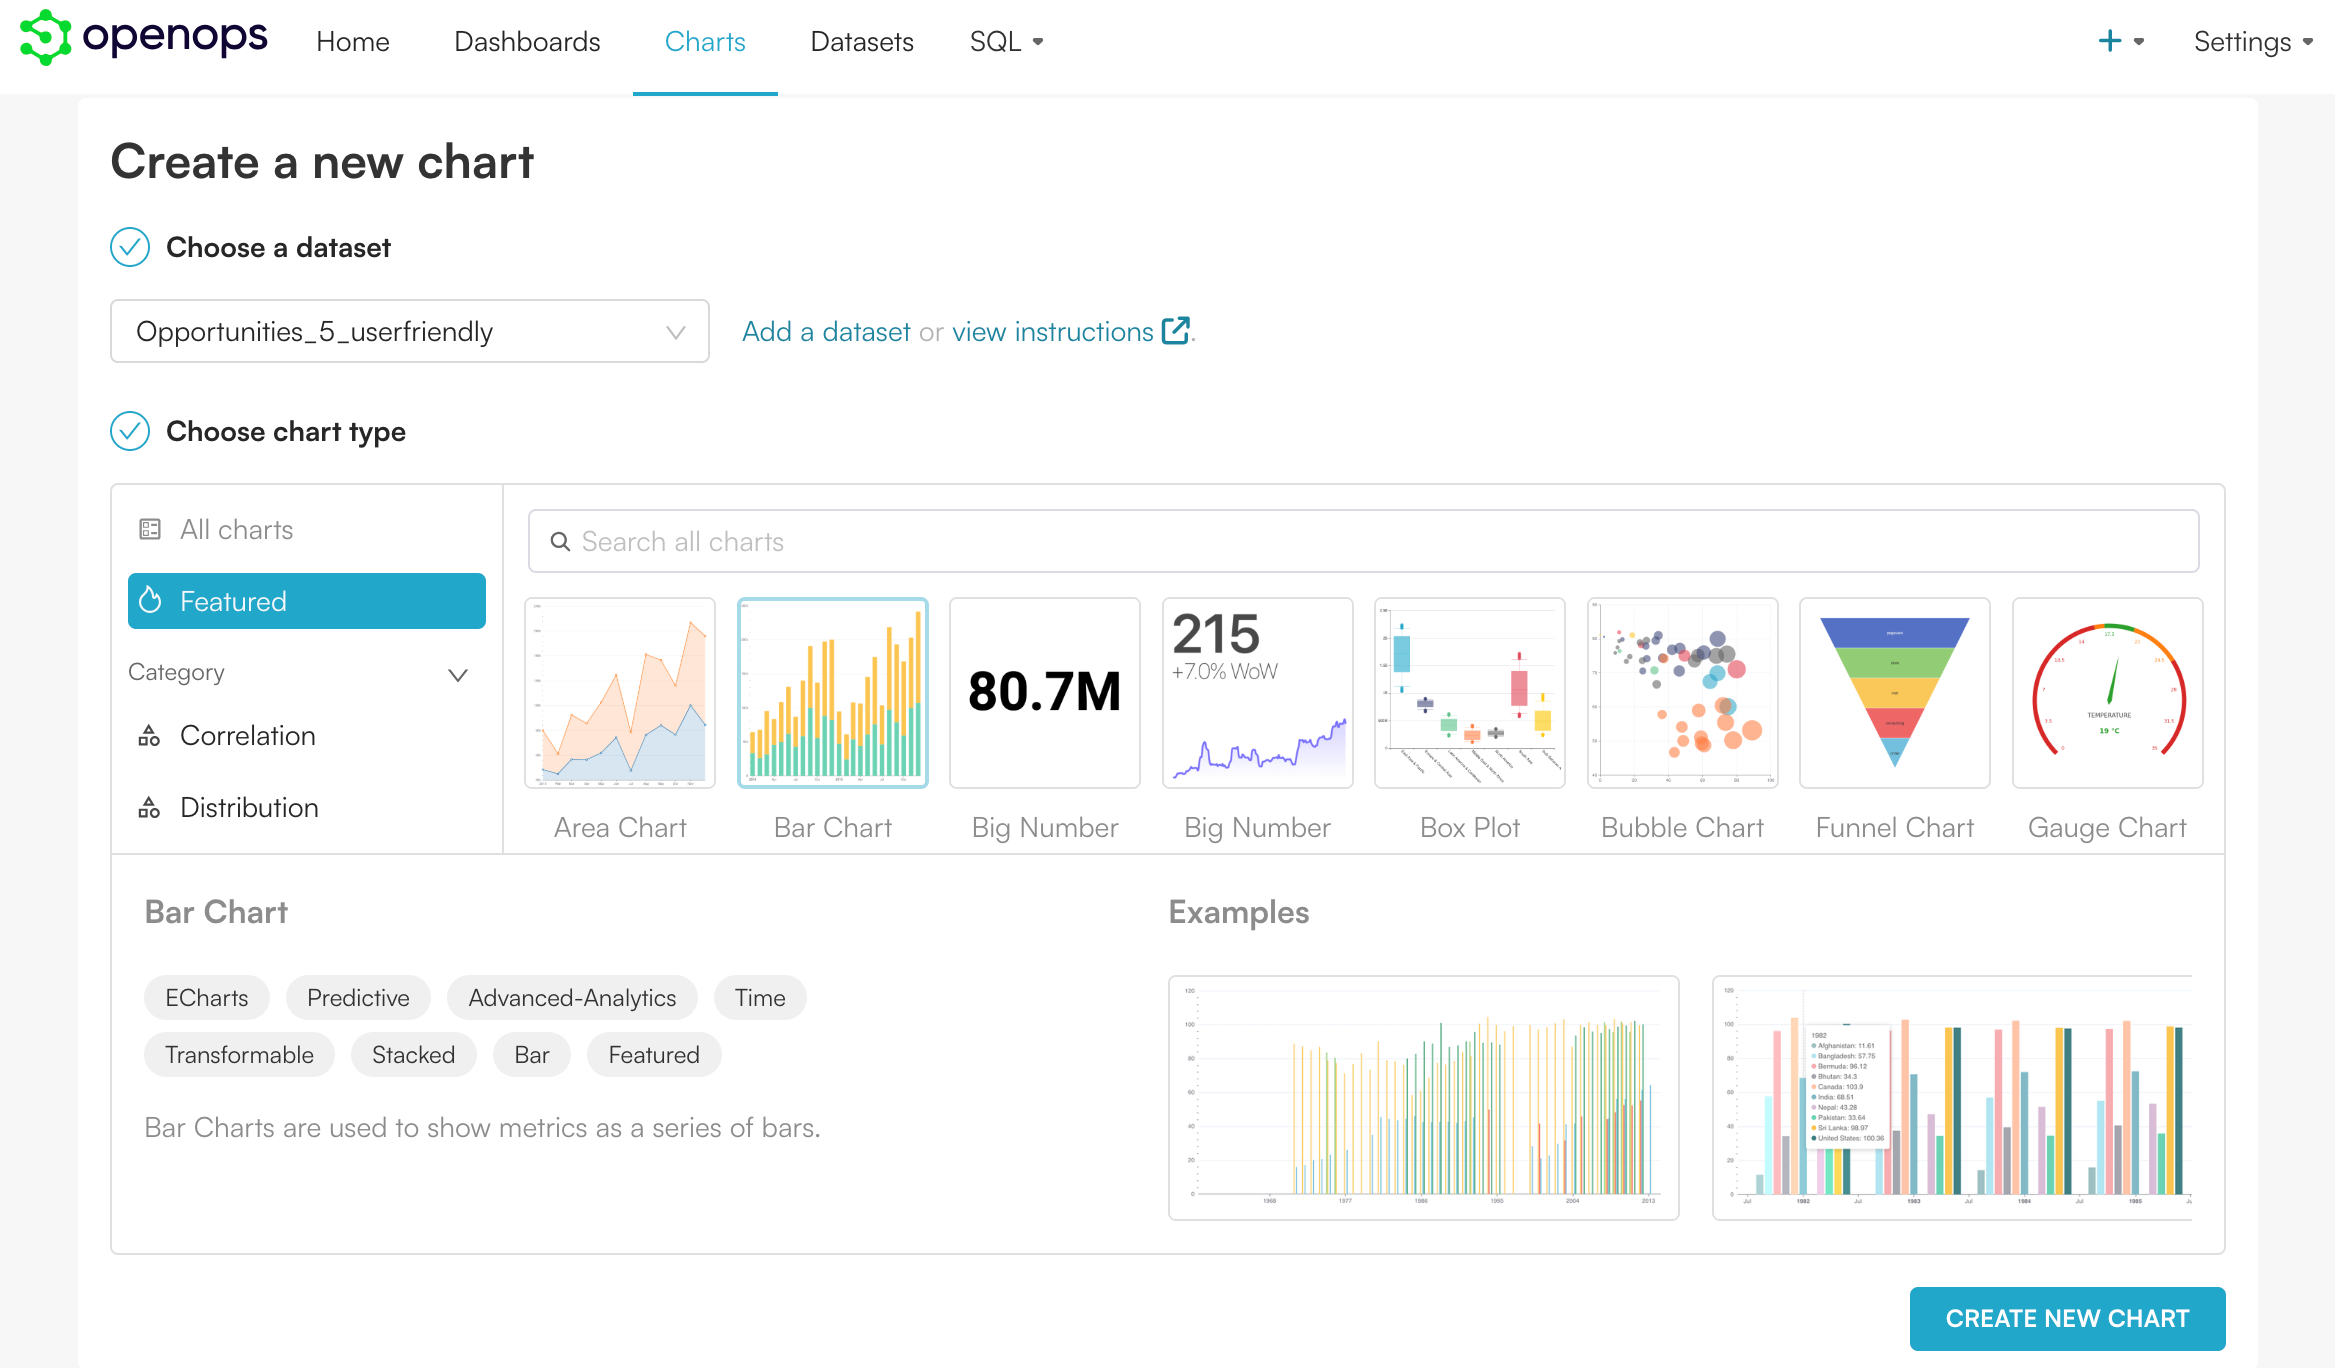
- In the Create a new chart view, select a chart type, then click Create new chart:
- Configure your chart. Refer to this Superset documentation page if you need help. To preview the configured chart, click Create chart in the right pane.
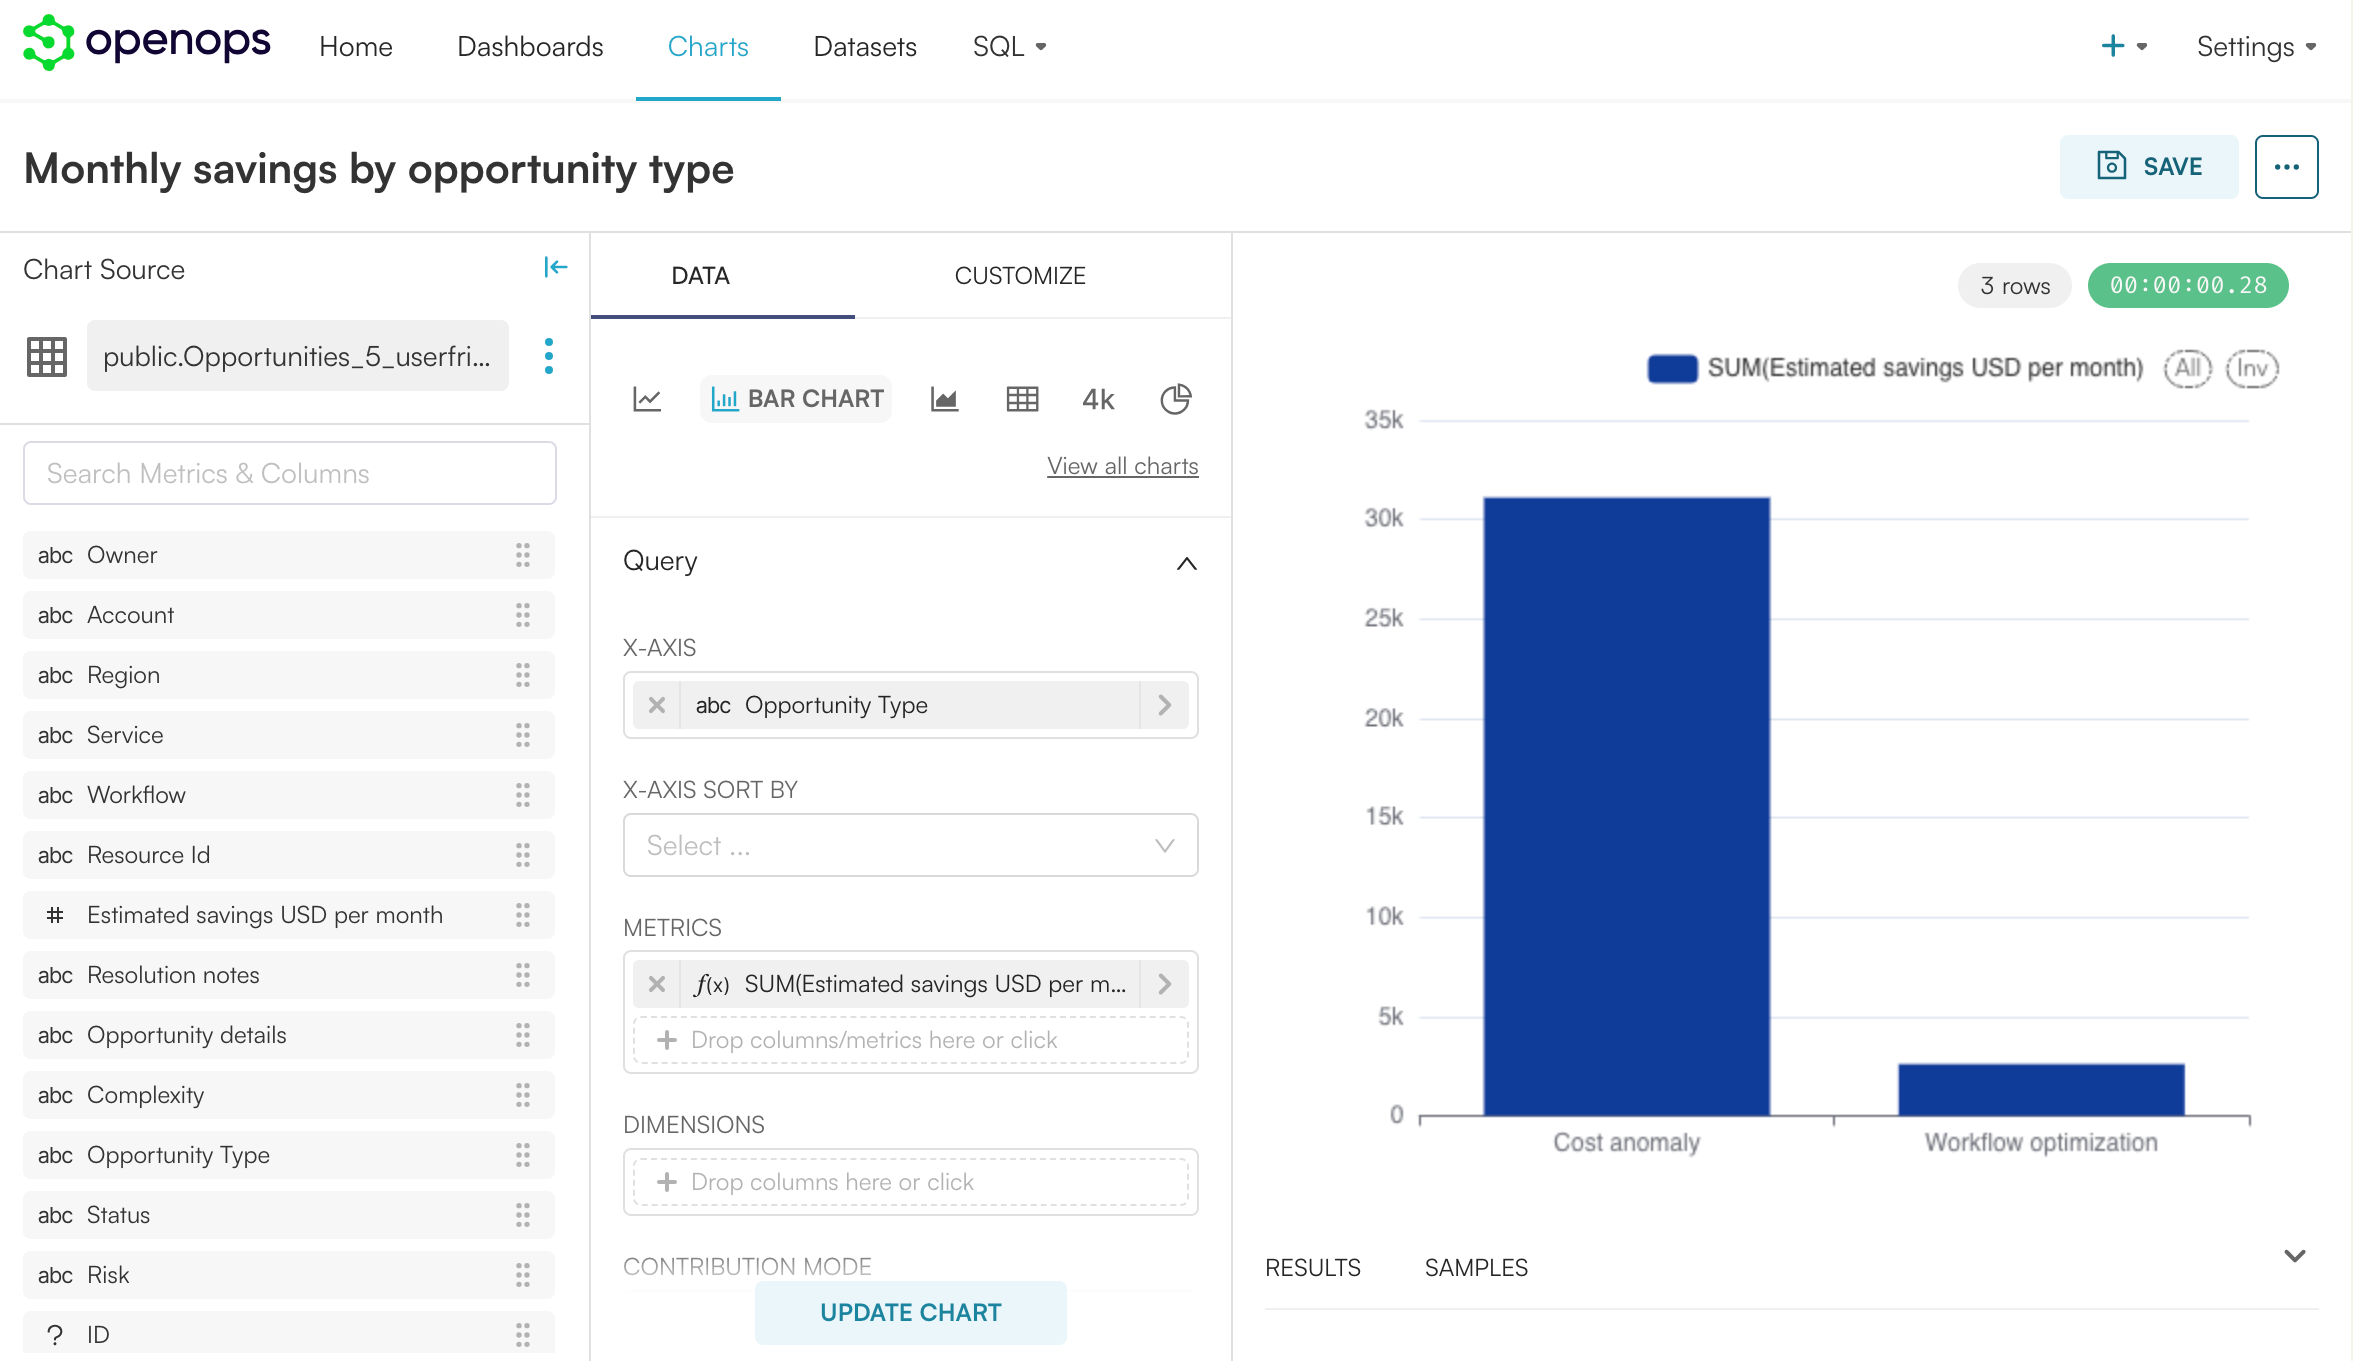
- If you make further changes to the chart, click Update chart to refresh the preview.
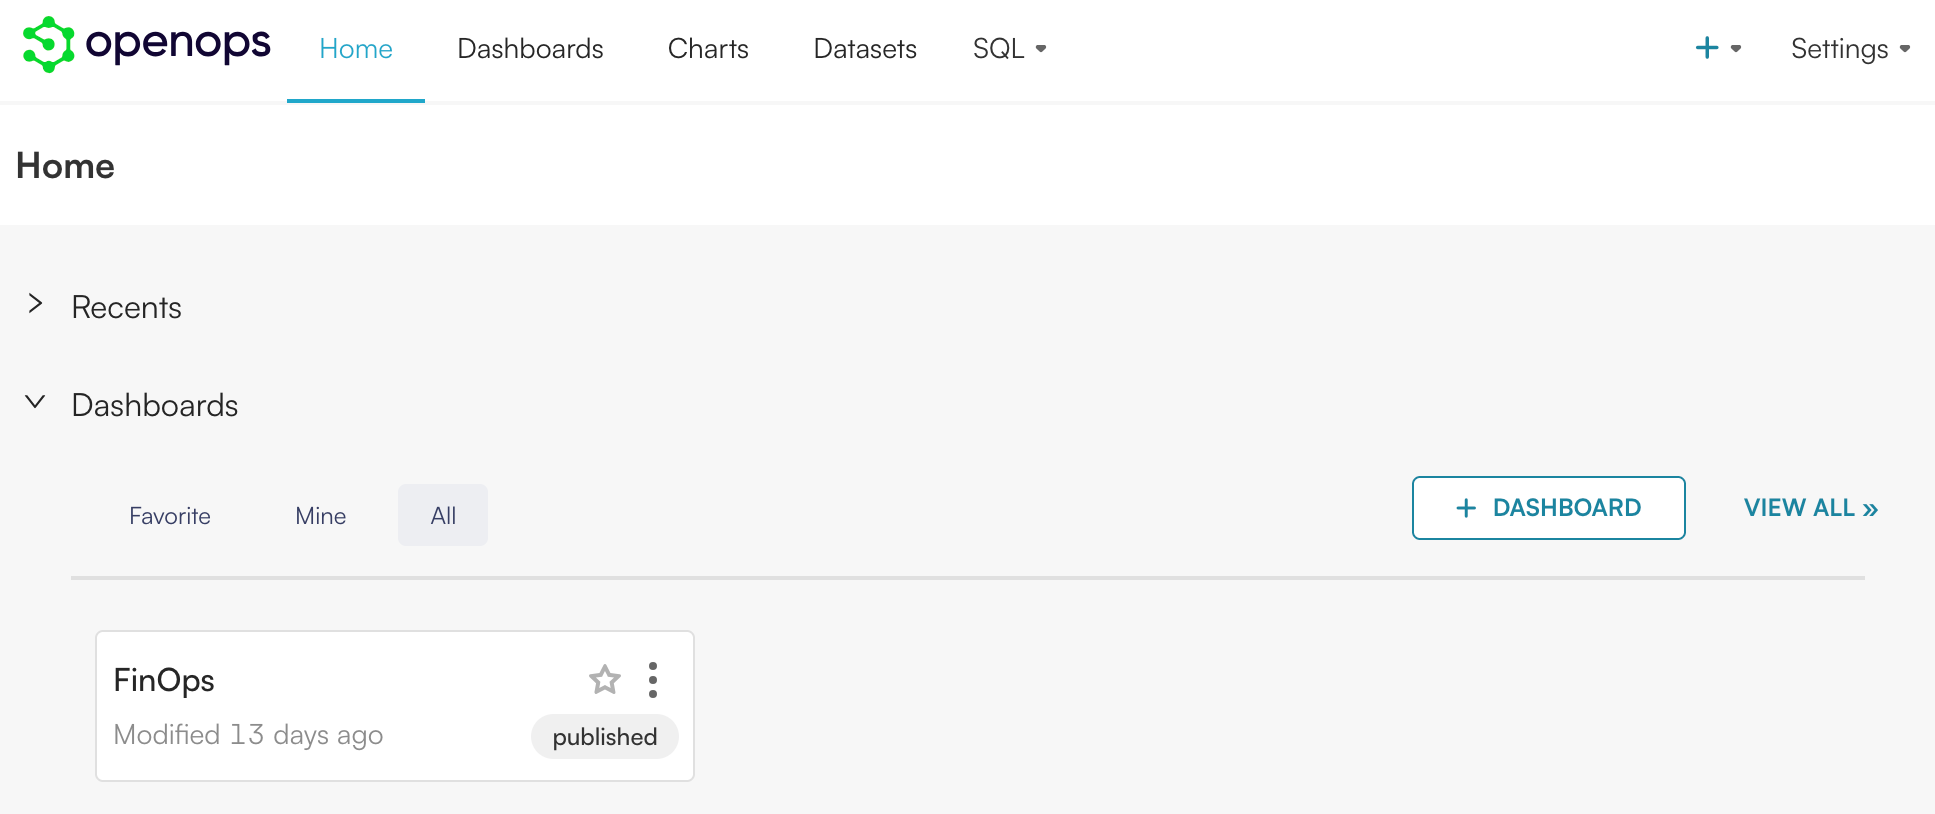
- When you’re done, click Save. In the Save chart dialog, select FinOps in the Add to dashboard dropdown:
- Click Save. When you go back to the Analytics view in OpenOps, you can see that the chart is now displayed there:
Connecting to external data sources
Here’s what you can do to connect OpenOps Analytics to external data sources such as CSV files:- In the Analytics admin portal, in the top right corner, click Settings, then Database Connections.
- Click + Database to connect to an external data source, such as your own Postgres instance or Google Sheets.
- Once you have created a database connection, if you’d like to upload CSVs to it, click the Edit icon for the database connection:
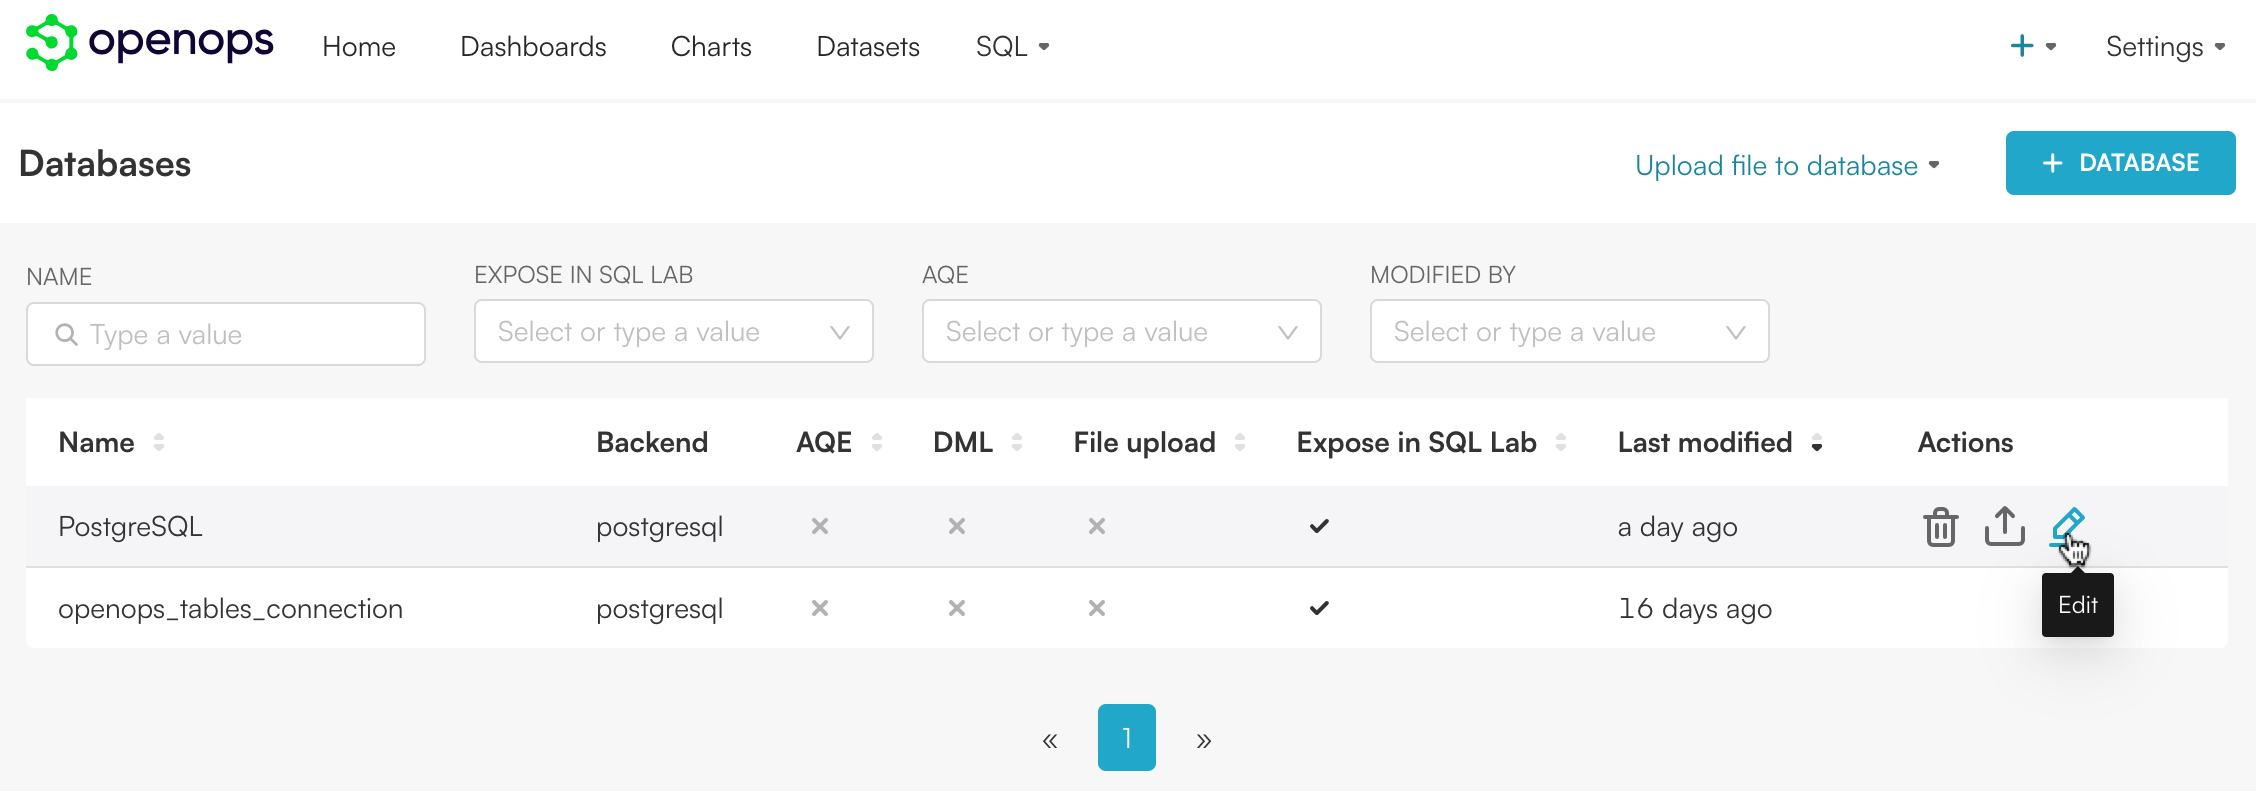
- In the popup that displays, go to Advanced > Security, scroll down, and enable Allow file uploads to database.
- Click Finish.